TESTGEAR

UMI-1 USB Measurement Interface


You’ve spent hours—maybe even days or weeks—planning and installing your system. Don’t leave the final performance to chance. Tuning by ear is often a frustrating process of turning dials and moving sliders in your DSP only to decide that what you’ve just done stinks.


Stop guessing!

I'm really enjoying my UMI-1. The test tracks on the cd make all the difference, in my opinion. It also helps to be able to securely fasten the mic to my headrest.​
Norby Urbano

Audiofrog’s new USB Measurement Interface is a complete microphone kit designed to work with most PCs, Macs and tablets that include a USB port.

The UMI-1 is suitable for use with most acoustic measurement and analysis software including Room EQ Wizard (REW), True RTA, Holm Impulse, ARTA and others.

real time
frequency response
measurement and analysis

The adjustable microphone stand is designed to mount easily to the car’s headrest using a Velcro® strap and places the microphone in the ideal location for real time frequency response measurement and analysis.

The TM-1 omnidirectional microphone provides response from 20 Hz to 20 kHz. 

A separate calibration file for each serialized microphone is available from Audiofrog.

Audiofrog UMI-1 Kit includes:

  • 6 mm Omnidirectional Measurement Microphone with Calibration File
  • USB Sound Card with Mic Input and Stereo Line Output
  • Microphone Stand with Integrated Extension Cable
  • 3.5mm Stereo to RCA Adapter
  • 3.5mm Male to Male Adapter
  • Velcro Headrest Strap
  • Extension Cable
  • Carrying Case
  • Test CD

DOWNLOADS

Download detailed and straightforward instructions for setting up Room EQ Wizard and True RTA for use with the UMI-1. You’ll also find target curves for each analyzer that will help you with the equalization process that are  important for making your system perform its best. Finally, the Liner Notes for the Tuning CD will help you use the test tracks that have been carefully designed and chosen to help you hear what your system should do when it’s tuned correctly.

How to:

To view any of the files:

  1. Right click on the link
  2. Choose “Open link in new tab”

To download any of the files:

  1. Right click on the link
  2. Choose “Save link as”
  3. You will be prompted to save the link to a location on your computer
  4. Choose the location and click “save”.

FAQ

Most frequent questions and answers

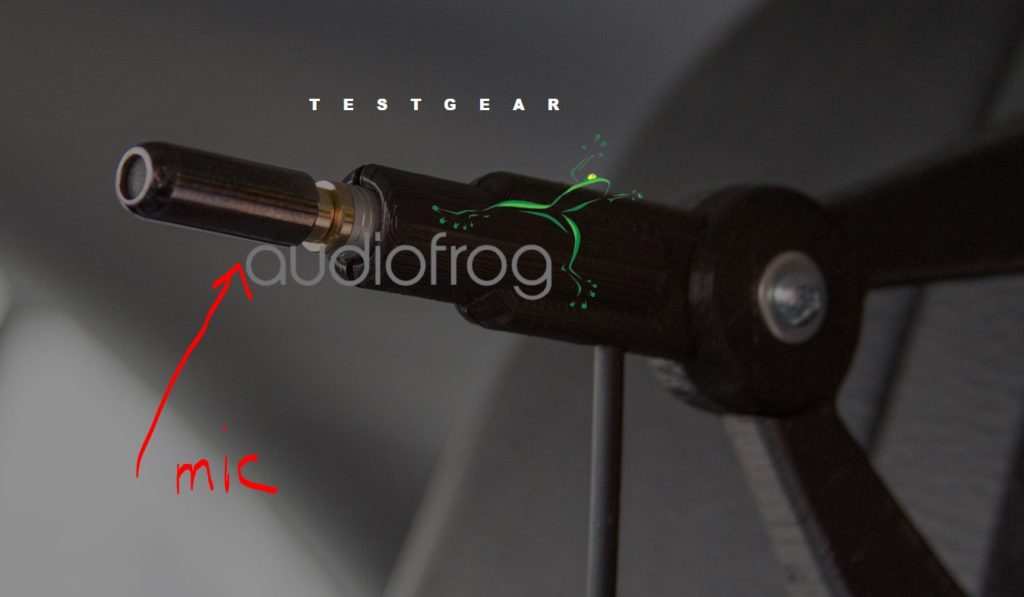
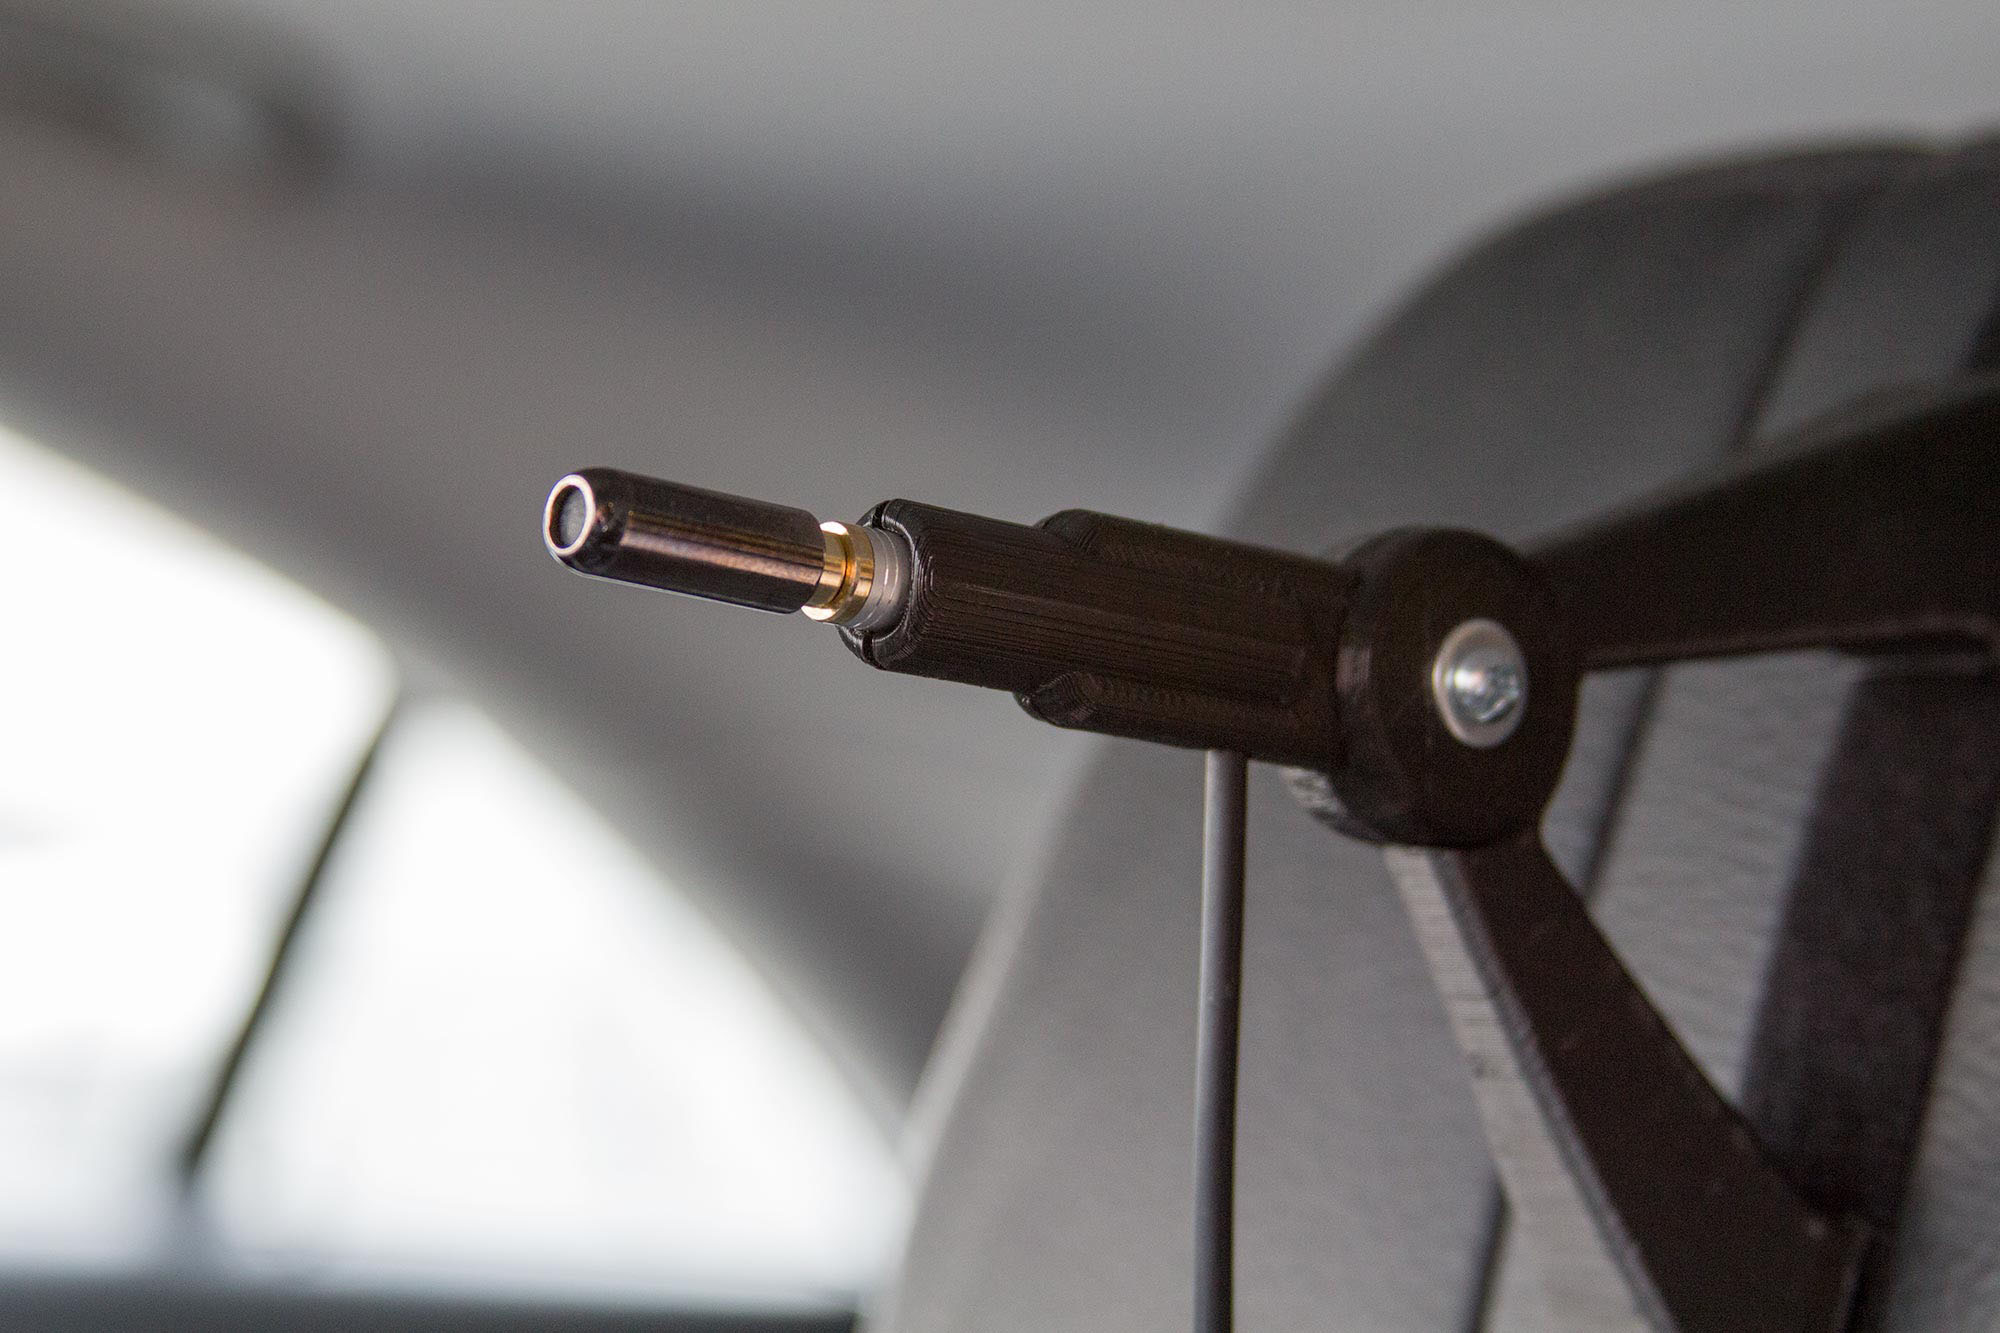
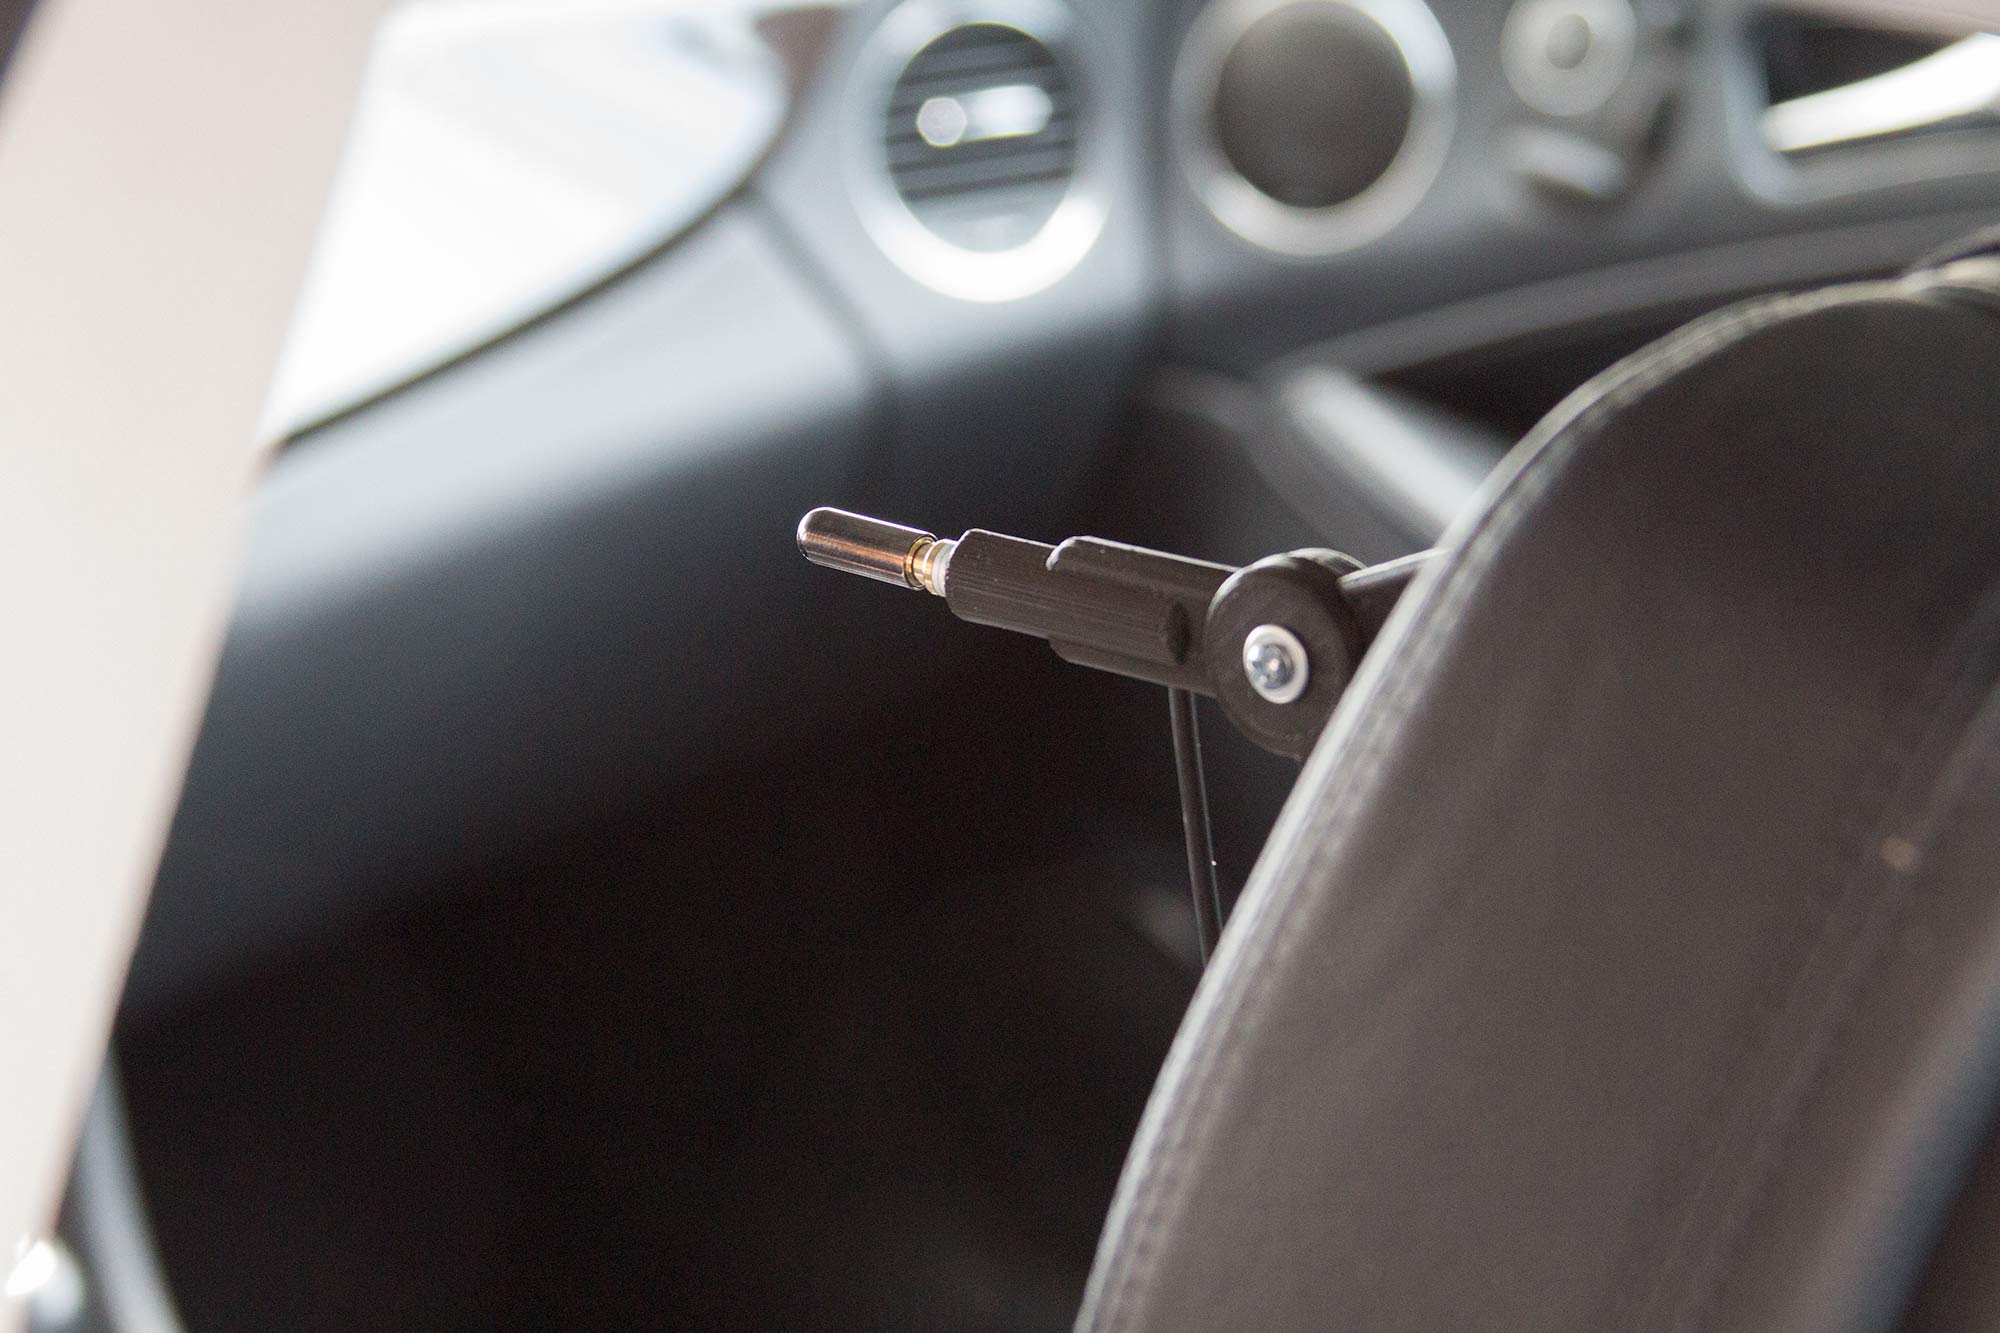
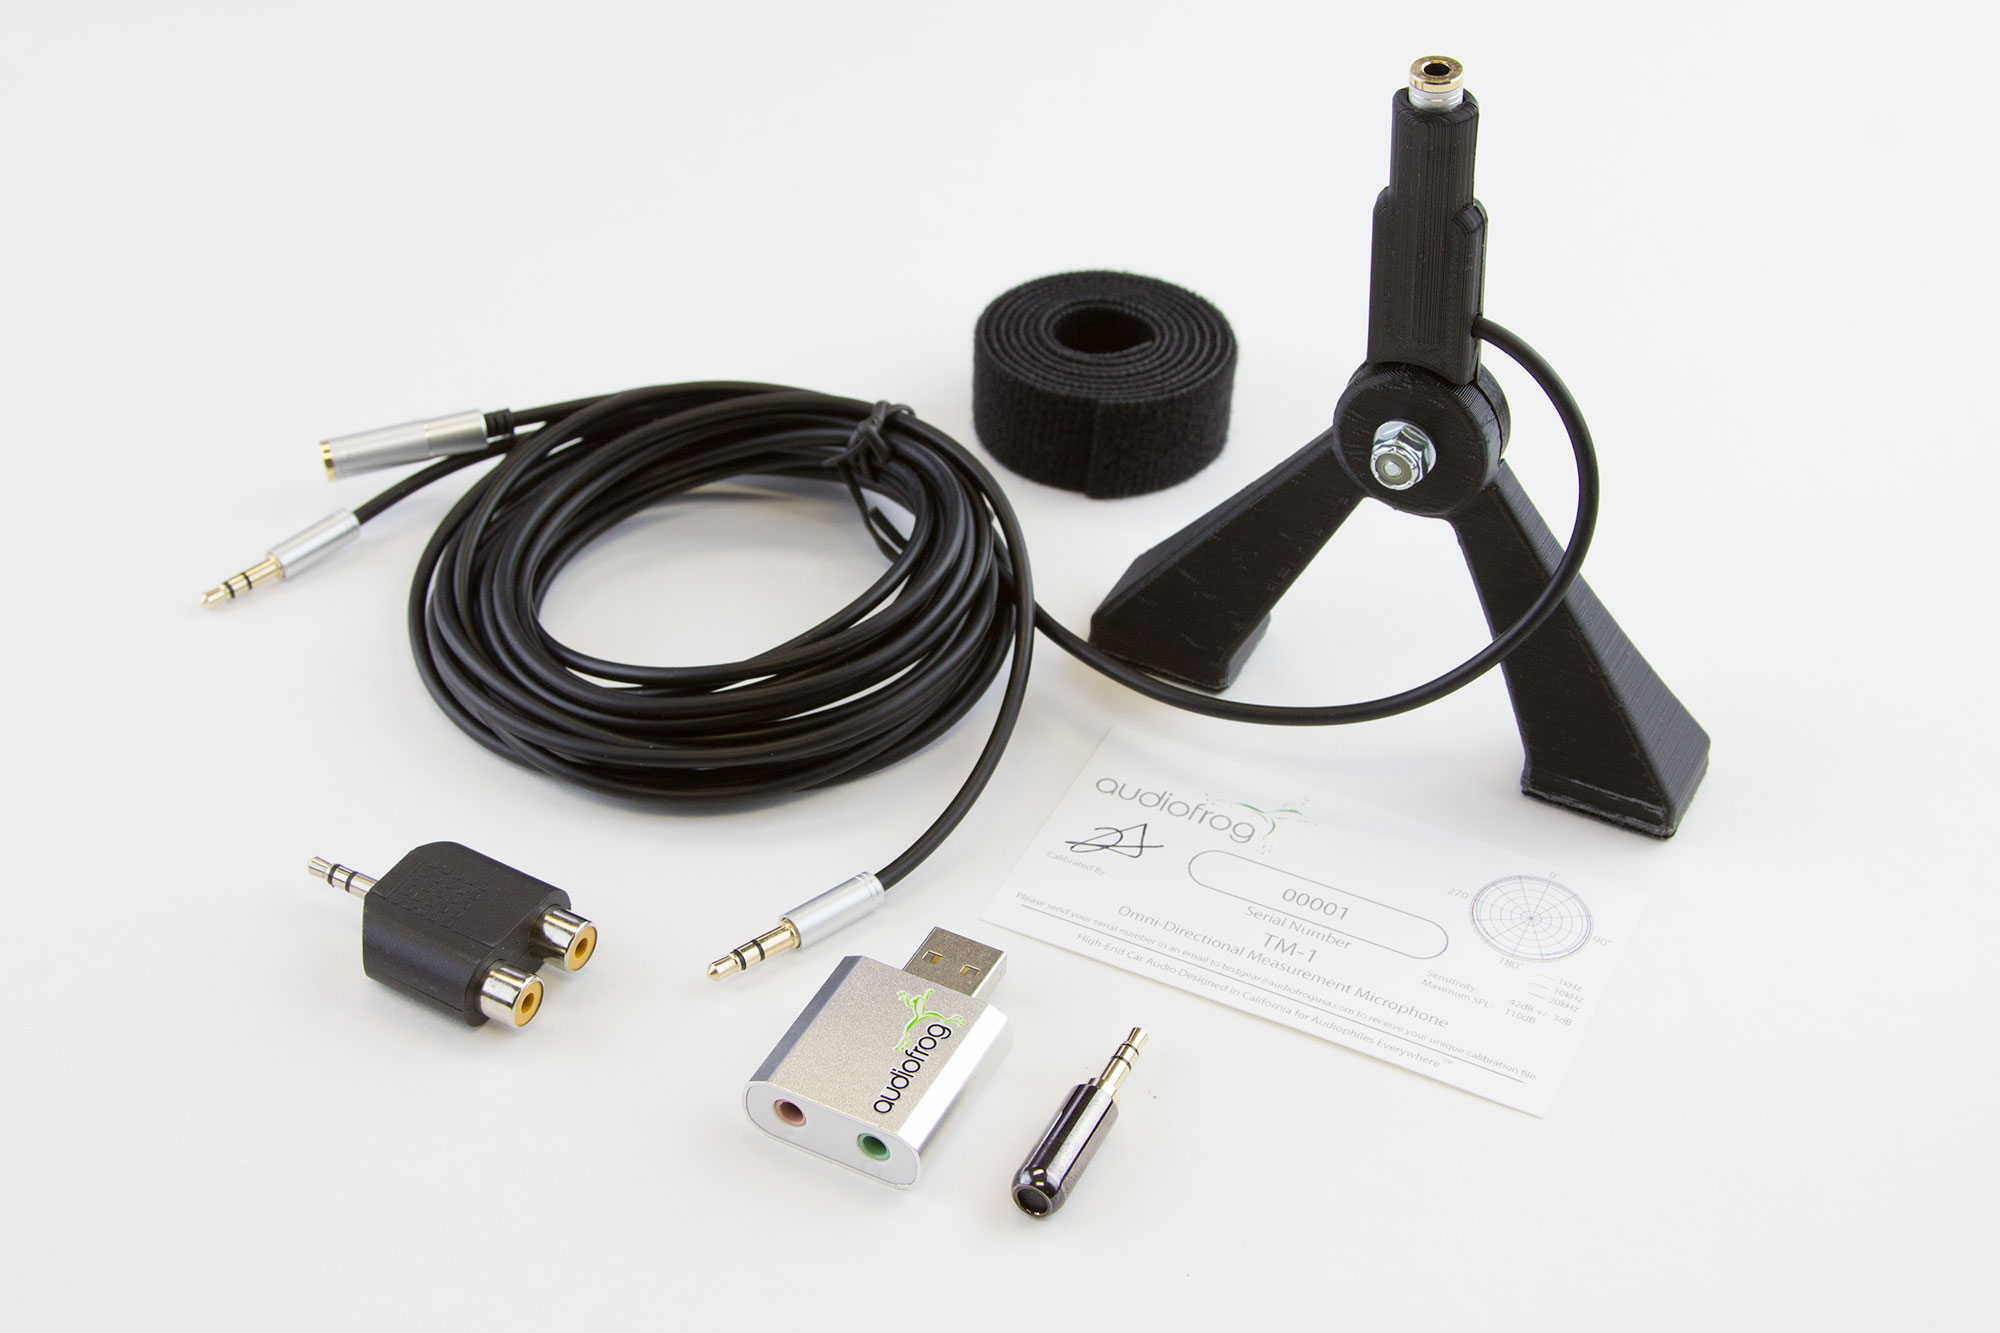
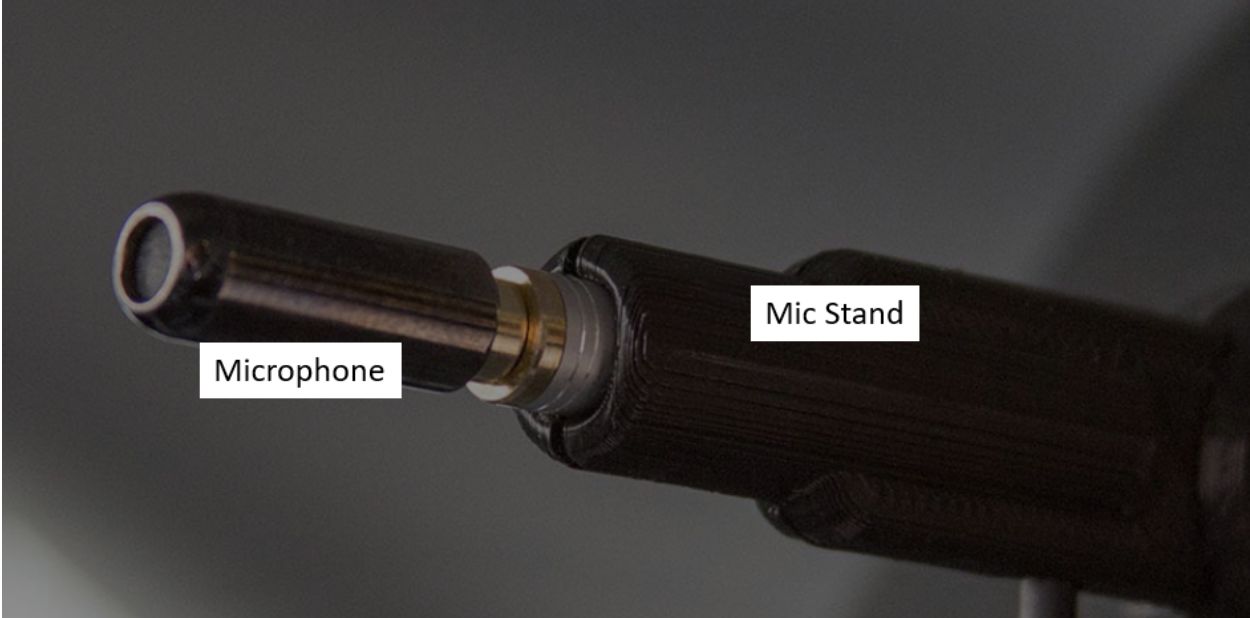
First, is the microphone plugged into the stand? The microphone is the little 3.5mm jack-looking thing in the plastic bag in one of the loops. When it’s plugged in, it will look like this:

Picture of mic plugged into mic stand


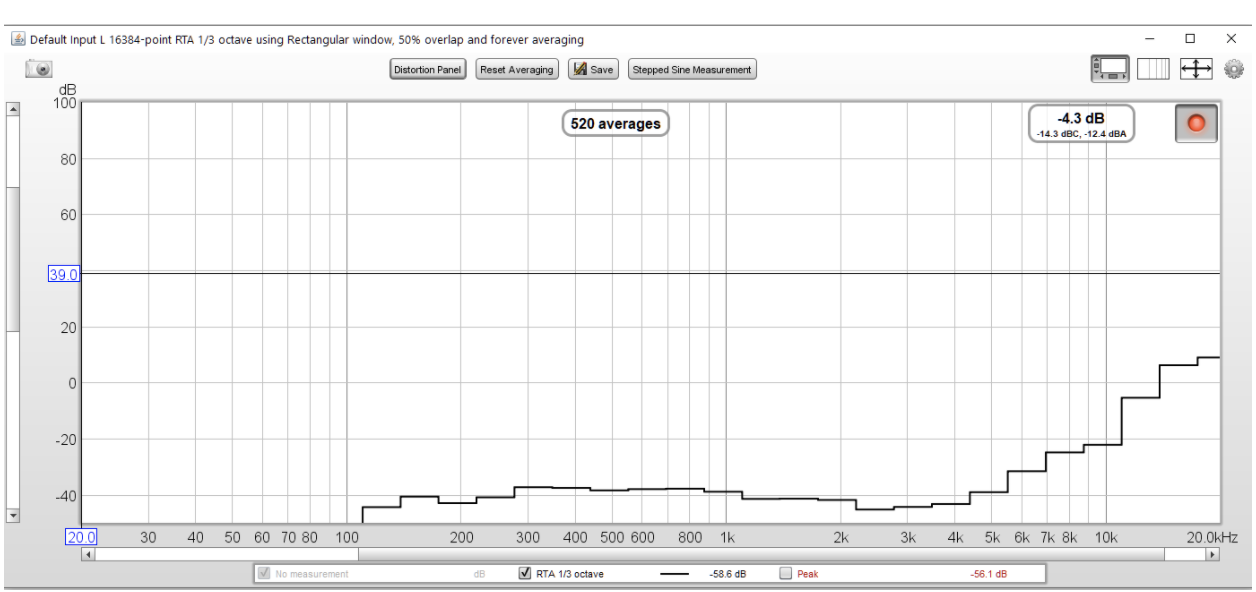
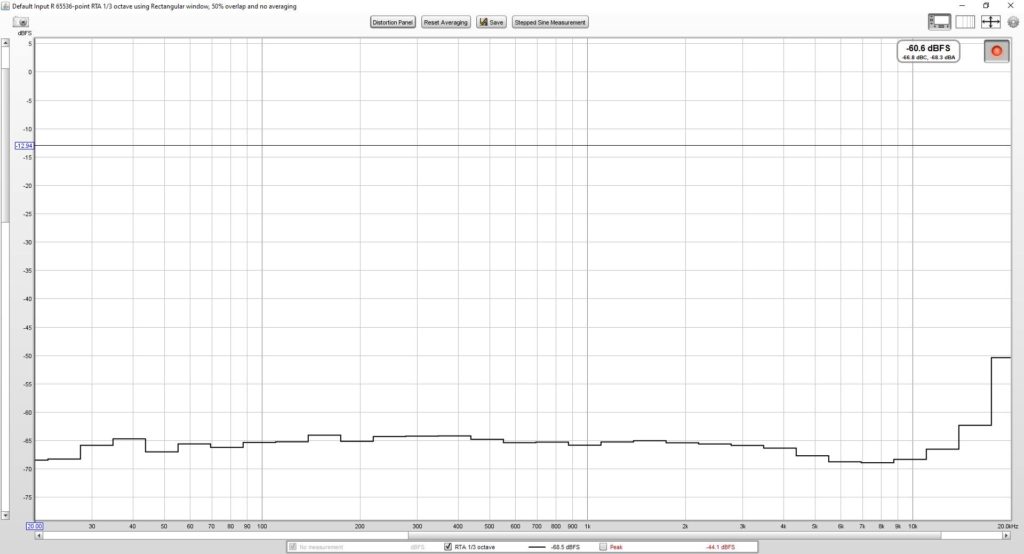
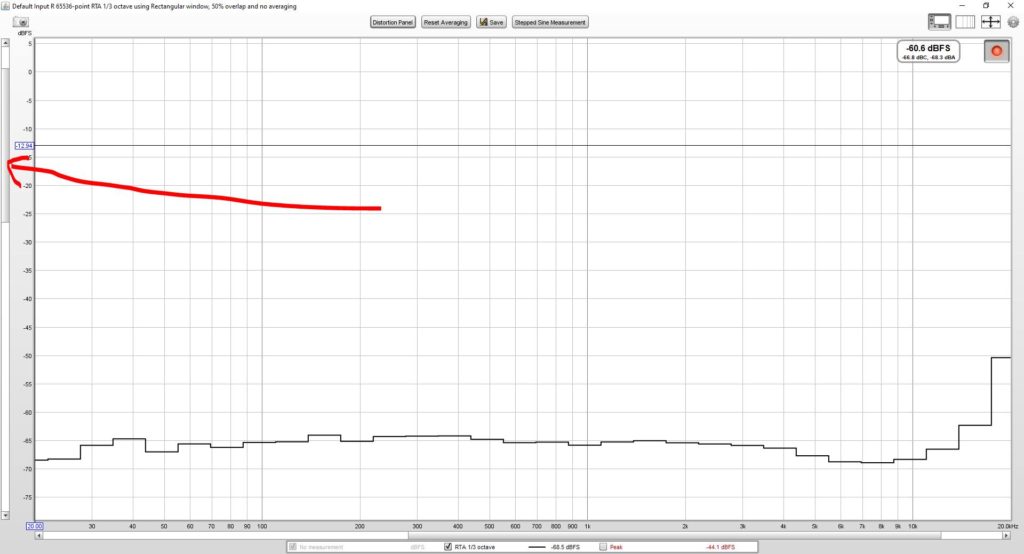
With PC based analysis software, the RTA window can offer a VERY wide view that might not be available on a single purpose tool. What you see in the graph is residual noise, either in the computer’s electronics or ambient noise in the room, modified by any of the calibration files that you have currently loaded. One might be the microphone calibration file and one might be the soundcard calibration file.

This is no big deal because when you turn on the system you’re going to measure, it will be MUCH louder than that noise—it won’t affect the measurement so long as the pink noise coming from the syst

The cables may not be plugged all the way in. If this is the first time you’re plugging them in, you may need to push extra hard. 

There’s been a revision in the Windows sound settings. Instead of clicking on the little speaker in the lower right of your system tray, type “Control Panel” in the search box in the bottom left of your system tray. When the option for the control panel appears, click on it and then choose “Sound” as in the picture below. Then, the settings will look like the ones in the setup guide.

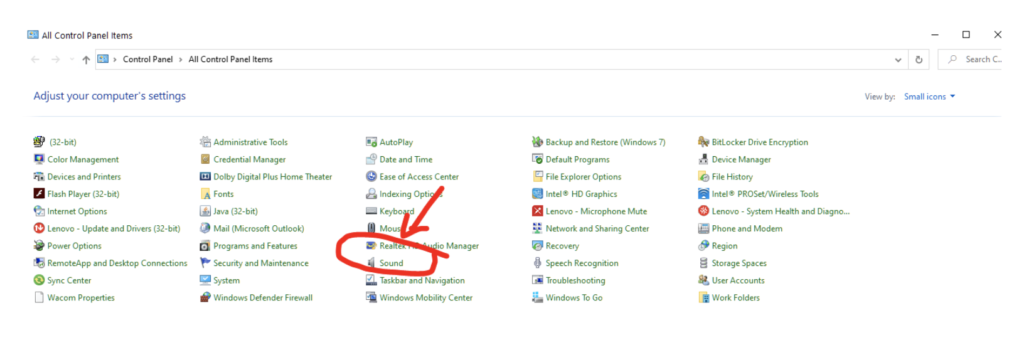
Clear the SOUNDCARD calibration file in the Soundcard Preferences window. If you’re using the pink noise on the CD or on your phone via BT, you don’t need that calibration. 

Bluetooth is a lossy compression algorithm. If your phone and your head unit don’t include AptX, then they probably default to SBC, which is the basic Bluetooth codec. Sounds above about 12kHz are removed by that algorithm.

If you’ve ripped the CD into your iTunes or some other media player as an MP3, then high frequencies are also eliminated by that codec. No need to worry, just don’t pay any attention to those frequencies.

Download the document “A Straightforward One-Seat Tuning Process and Some Notes About Why it Works” on the Testgear section of the Audiofrog website and begin on page 38. There are step by step instructions for importing, viewing and scaling the target curve to the measurement. 

Please uninstall your version (which is probably a beta version and download version 5.19.

Sorry. No one here has a Mac. We don’t know how to use a Mac, but we understand that the Mac audio setup is pretty similar.

Unfortunately, no. Our license for the music on the CD only allows us to distribute it as part of the kit. 

Unplug the charger/power supply for your computer. Depending on the model of the computer, the noise filtering in the supply may be causing the peak.

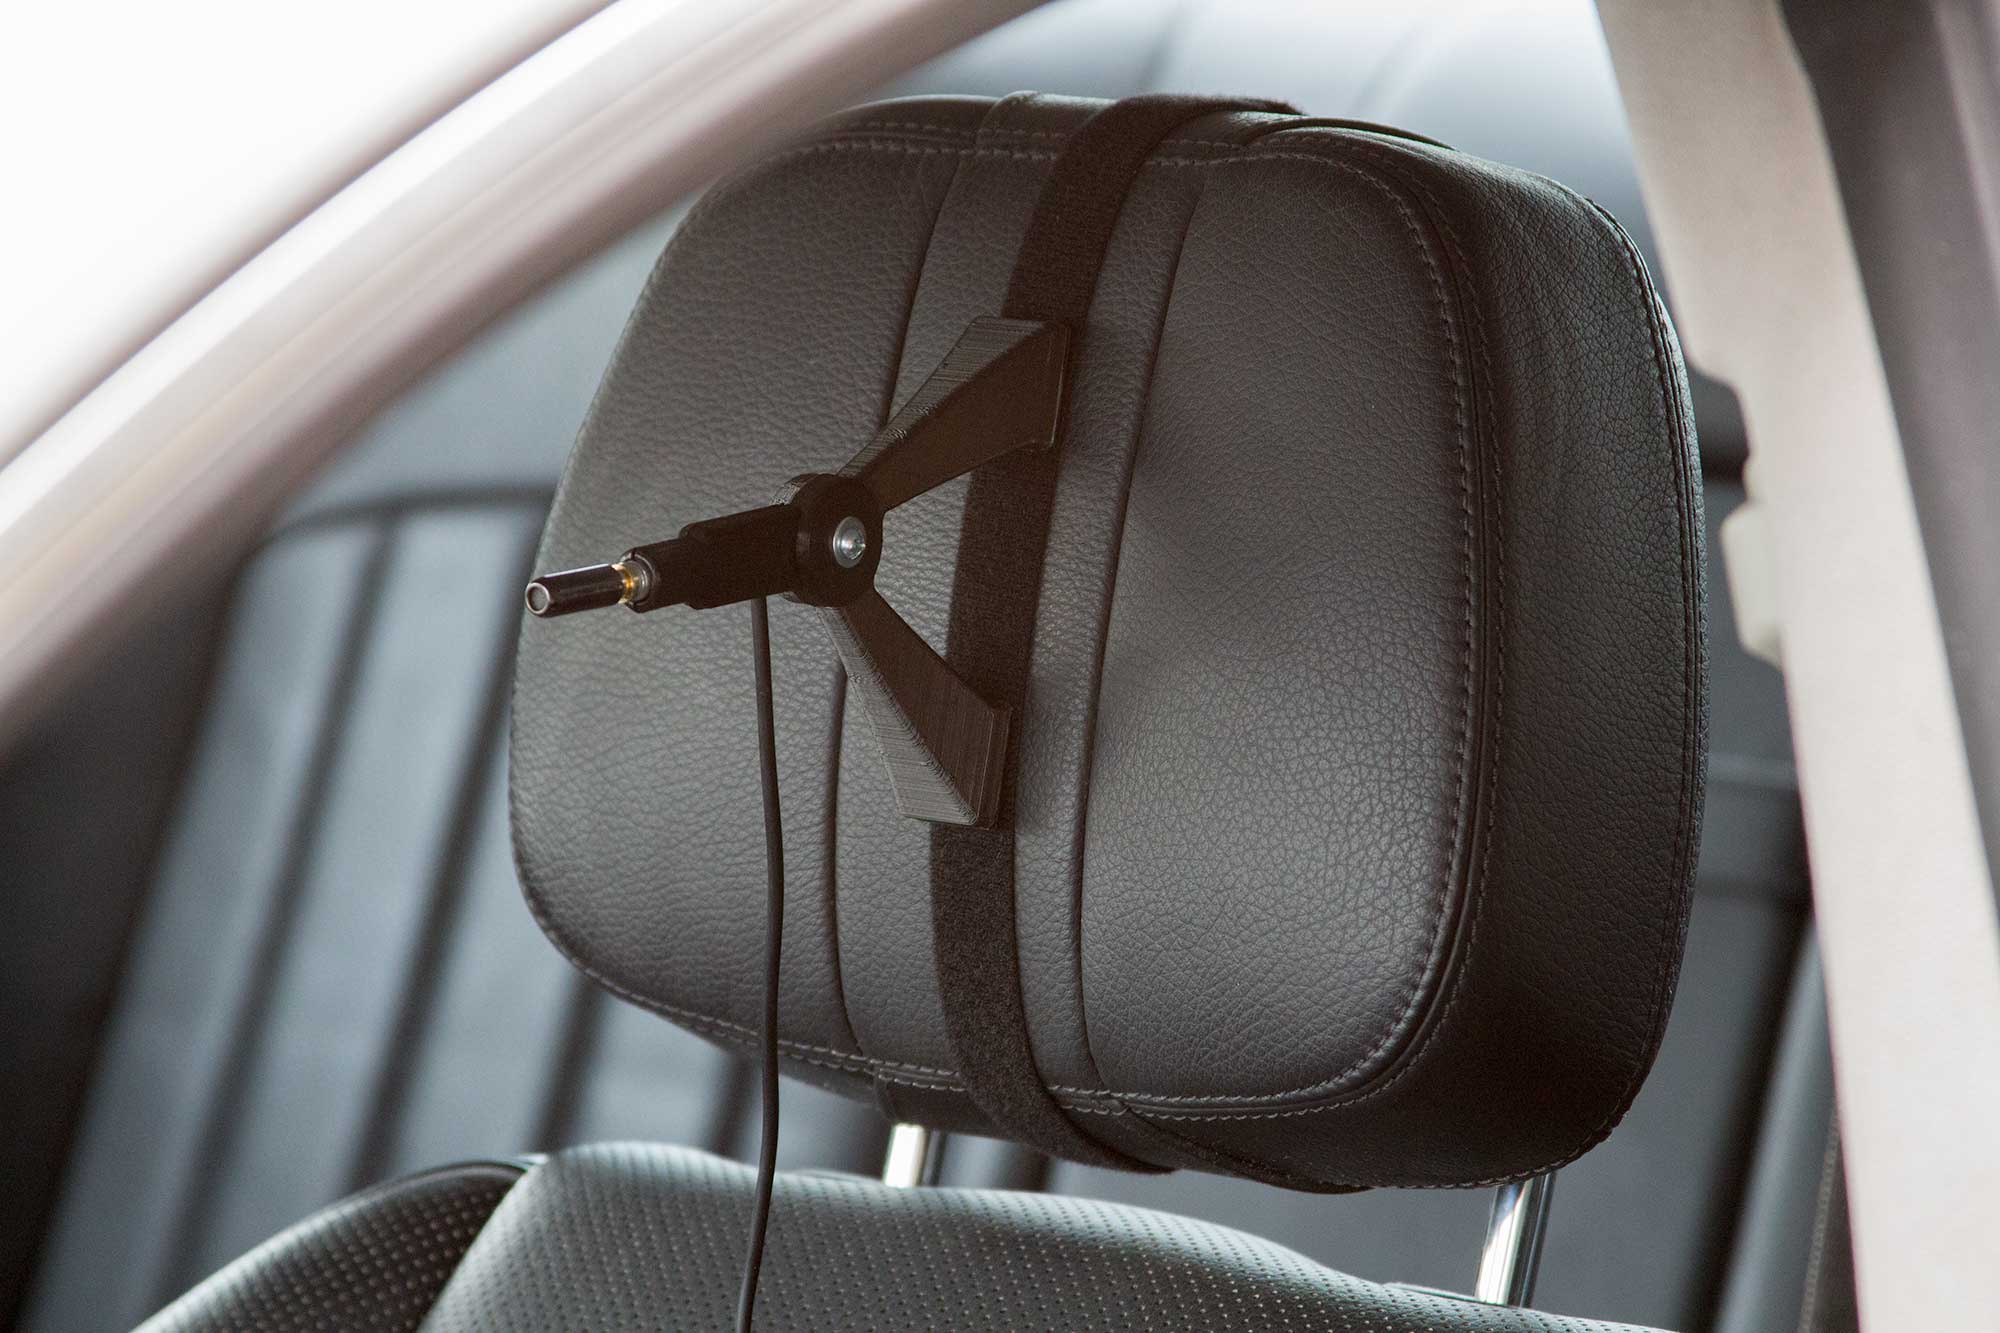
You should be outside the car. It’s much easier that way. That’s why we provide the extension cable for the microphone.

When you use a PC and an RTA program, it’s possible to see a bigger view than is necessary. When you use a single purpose tool, like a hand held RTA, this isn’t possible.
the dB scale is logarithmic. That means that 10dB is 10 x the power of 1 dB. 20dB is 100 x the power of 1dB. 30dB is 1000 x the power of 1dB. 40dB is 10,000 x the power of 1dB. 50dB is 100,000 x the power of 1 dB.
So, when you see something that’s 70dB quieter than your measurement, it’s literally NOTHING. So long as your measurement is something like 20dB louder than the background noise, that’s enough.
So, when you set up REW and you turn on the RTA with nothing playing, it’s going to look like this:
 
 
The relatively flat line is very low level noise in your computer or ambient noise in the car. It may not be flat at low frequencies. You may have some humps and peaks.
But nothing is playing. There’s no pink noise.
The peak at high frequencies is the application of the mic and soundcard calibration files. Those frequencies are boosted in the RTA to compensate for the frequency response of the soundcard and the microphone. This is what makes it possible to make high quality measurements with a free program and a $200 mic kit. Before these programs, we had to buy a really expensive microphone that had as close to perfectly flat response as possible. That mic is $500 or more.
I have a bunch of mics of varying flatness, including an ACO Pacific that’s several thousand dollars. It’s flat. No one is buying one of those to tune their car on the weekend.
So, when you see this, don’t freak out and think that something is wrong. Turn on the pink noise and watch the graph. If all of a sudden, this disappears and you can’t see a graph on the screen, go to the scroll bar on the left and move it up and down until you see the graph.
If you don’t see a graph that’s at a much higher level than this one, then check to see that the microphone is plugged into the stand, like this:
Then, check that all of the cables are plugged all the way in.
Once you get the graph on the screen, go to page 38 in this document where it explains how to scale the target curve and your measurement so you can begin tuning.